### Need Altair to work first
import pandas as pd
import altair as alt
alt.renderers.enable('notebook')
RendererRegistry.enable('notebook')
!conda install -c conda-forge altair vega_datasets notebook vega
%matplotlib inline
budget = pd.read_csv("data/mn-budget-detail-2014.csv")
budget.head()
| category | detail | amount | |
|---|---|---|---|
| 0 | UNIVERSITY OF MINNESOTA | Higher Education Asset Preservation (HEAPR) 1 | 42500000 |
| 1 | UNIVERSITY OF MINNESOTA | Minneapolis; Tate Laboratory Renovation | 56700000 |
| 2 | UNIVERSITY OF MINNESOTA | Crookston; Wellness Center | 10000000 |
| 3 | UNIVERSITY OF MINNESOTA | Research Laboratories | 8667000 |
| 4 | UNIVERSITY OF MINNESOTA | Duluth; Chemical Sciences and Advanced Materia... | 1500000 |
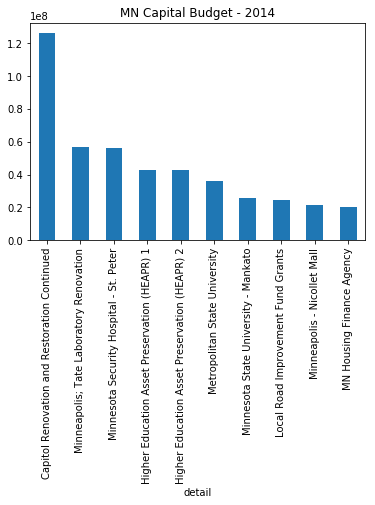
budget_top_10 = budget.sort_values(by='amount',ascending=False)[:10]
budget_top_10.plot(kind="bar",x=budget_top_10["detail"],
                   title="MN Capital Budget - 2014",
                   legend=False)
<matplotlib.axes._subplots.AxesSubplot at 0x11461f588>
c = alt.Chart(budget_top_10).mark_bar().encode(
    x='detail',
    y='amount')
alt.Chart(budget_top_10).mark_bar().encode(
    x=X('detail'),
    y=Y('amount'),
    color="category"
)
---------------------------------------------------------------------------

NameError                                 Traceback (most recent call last)

<ipython-input-9-dbd371227fad> in <module>()
      1 alt.Chart(budget_top_10).mark_bar().encode(
----> 2     x=X('detail'),
      3     y=Y('amount'),
      4     color="category"
      5 )


NameError: name 'X' is not defined
import altair as alt
from vega_datasets import data

# for the notebook only (not for JupyterLab) run this command once per session
alt.renderers.enable('notebook')

iris = data.iris()

alt.Chart(iris).mark_point().encode(
    x='petalLength',
    y='petalWidth',
    color='species'
)